


Graphing Calculator |

Calculations
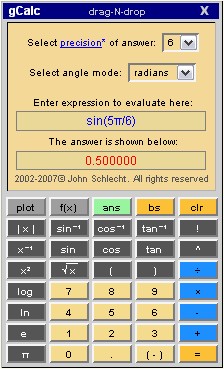
Click on the larger of the two calculator icons at the left to reveal a graphing calculator. It should appear as shown at the right. The keys and/or keyboard may be used to make entries to the display. Enter on the keyboard or = on the calculator will evaluate the expression entered. The next keystroke will clear the display and the result from your prior computation wil be dimmed in the answer block. If you want to use the previous answer in your computation, just click the ans key. You can select the precision of your answer from 3 to 8 significant digits. Beyond that, your answers will be shown in scientific notation. You can also select the mode that you would like to be in for any trigonometric calculations. The 2 choices are radians and degrees. Most calculators operate in radians, so this is the default. 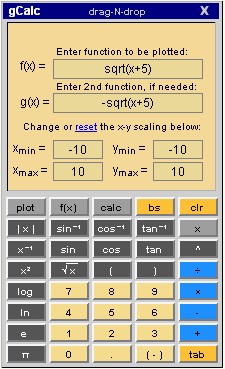
Graphing
In order to graph, you must first enter a function. Click the f(x) key to reveal the screen shown at the right. You may graph 2 functions at the same time by entering a function for f(x) and another for g(x). In this example, a parabola opening right, can be graphed by graphing the positive and negative roots of the given expression. You can change the x and y ranges. If you want to reset, simply click the reset link. Note that the equal key has become the tab key. Simply click it to move from field to field. All error statements will appear at the top of the screen and focus will go to the faulty input. 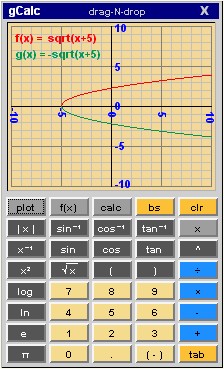
All that remains now is to click the plot button. The display at the right shows the plot of the functions input above.
The two functions are different colors so you can tell them apart. The function statements are also show at the top left.
If the scaling isn't good, simply go back with the Once you are done graphing, click the calc key and you'll be back in calculator mode. Enjoy. |