Subject Areas
Basics
Algebra
Geometry
Statistics
Trigonometry
Calculus
Tools / Misc
GED
Graphing
Math Tools

Understanding Numbers
Fractions & Decimals
Mixed Numbers
Proportions
Order of Operations
Scientific Notation
Money
Time


Diamond Problems
Algebra Tile
Generic Rectangles
Functions
Matrices
Polynomial Functions
Exponential Functions
Sequences & Series
Conics


Lines & Angles
Slope Equations
Congruent Triangles
Concurrency & Midsegments
Quadrilaterals
Similarity
Right Triangles
Circles
Polygons
Volume
Surface Area


Combinatorics
Probability
Data Analysis


Angles, Functions & Laws
Unit Circle


Calculus Viewer Requirement
Limits
Derivatives
Integrals


GED Exam Information


Graphing Basics
Chart & Graph Interpretation
Family of Curves


Calculators
Graph Paper
Flash Cards


Number Line
Flash Cards
Flash Cards (Pos. & Neg. Numbers)


Decimal Operations
Fraction Operations
Fraction - Decimal - Percent Conversion


Improper Fractions - Mixed Numbers
Mixed Number Operations


Proportions
Measurement Conversion


Order of Operations
Pluses and Minuses


Scientific Notation


Making Change


Telling Time


Simple
Advanced


Plain Tile
Positive(+) & Negative (-) Tile


Binomial Multiplication
Factoring


Function Operations
Function Composition
Calculate Slope & Linear Equation Forms
Absolute Value Equations
Systems of Equations
Graphing Linear Equations
Graphing Linear Inequalities
Inverse Functions
Direct, Inverse & Joint Variation


Matrix Basics
Matrix Multiplication
Matrices in Motion


Complex Numbers
Solving Quadratic Equations
Synthetic Division
Remainder & Factor Theorem
Rational Roots Theorem
Descartes Rule of Signs
Partial Fraction Decomposition
Solving Radical Equations


Exponents
Compounding
Exponential Function Graphing
Solving Exponential Functions
Logarithms
Solving Logarithmic Equations


Arithmetic Sequences
Geometric Sequences
Repeating Decimals


Circles & Ellipses
Hyperbolas
Parabolas


Distance & Midpoint
Add & Bisect Segments
Complementary & Supplementary Angles
Vertical Angles
Parallel Lines & Transversals


Slope Equations
Parallel & Perpendicular Line Equations


Corresponding Parts


Incenters


Parallelograms
Trapezoids & Kites


Similar Polygons


Using Geometric Means
Special Right Triangles
Trigonometric Functions


Chord Segment Lengths
Secant Segment Lengths
Tangent & Secant Segment Lengths
Inscribed Angles
External Angles Formed by Two Secants
Internal Angles Formed by Two Chords
Sector Areas
Arc Lengths


Angle Measure
Areas


Prism Volume
Cone & Sphere Volume
Pyramid Volume


Prism Surface Area
Cone & Sphere Surface Area
Pyramid Surface Area


Permutations & Combinations


Probability & Odds


Mean, Median & Mode
Measuring Variability
Histograms
Box & Whiskers Drawings
Normal Distribution


Angle Measure
Sine, Cosine & Tangent
Law of Sines
Law of Cosines


Unit Circle


Read Me First


Continuous Function Limits
Discontinuous Function Limits


Derivatives
Product Rule
Quotient Rule
Chain Rule
Derivative Applications
Implicit Differentiation & Related Rates


Indefinite Integrals
Definite Integrals
Definite Integral Applications
Advanced Integration Techniques


About GED Exam
xy Graphing
Answer Grid


Graphing Basics


Pie Charts
Horizontal Bar Charts
Vertical Bar Charts
Line Graphs


Family of Curves
Transformations


Basic Calculator
Graphing Calculator


Graph Paper


Flash Cards


bCalc
drag-N-drop
X
gCalc
drag-N-drop
X

__

Box and Whiskers Diagrams |

|
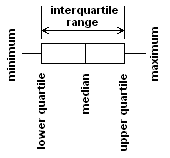
The primary purpose of this lesson is to illustrate how to create a box and whiskers diagram.
Given a data set, sort the data and calculate the following:

min
Q1
med
Q3
max
Any number less than Q1 - 1.5•IQ or greater than Q3 + 1.5•IQ is considered an outlier.
Q1-1.5IQ
Q3+1.5IQ
Outliers
|
© 2002- John Schlecht. All rights reserved.